Tonal density.
Originally published in Journal of Experimental Psychology, Volume
17, pages 585-92, 1934.
S.S. Stevens, Harvard University
One of the Os in Rich's experiment on tonal volume [1] reported, "The larger
[lower] tones seem to have a greater diffuseness. It seems as if the smaller
[higher] tones fill space more compactly, what they fill." Similar
characterizations of the phenomenal aspects of tones have appeared in the
protocols of several Os in more recent experiments. An O in an experiment
performed by Gundlach and Bentley [2] described high tones as "denser" and
"compacter" than low tones. Likewise, in Moul's a experiment, where she sought
to obtain phenomenal descriptions of the "thickness" or volume of tones, one
finds that a noise was characterized as "tight, hard, impenetrable" by an O who
described a tone of 700 cycles thus: "The tone somehow carries the meaning of "giveyness,"
of penetrability, of a certain looseness, a certain softness in the sense that a
vapor is soft." Another O in the same experiment experienced a tone of woo
cycles as "thick, dense, compact." The same tendency of Os to experience high
tones as dense, hard, compact, impenetrable was present in the author's 4
experiment on tonal volume and suggested that, density might be a discriminable
aspect of tonal stimuli, different from volume, pitch and loudness. The present
experiment was undertaken to test this possibility.
The Os used in the experiment were Dr. J. Volkmann (V), Mr. E. B. Newman (N),
Dr. J. G. Needham (Ne), and Mr. H. S. Odbert (Od). V and N had observed in the
experiment on tonal volume and were well trained in the technique used in that
and in the present experiment. Furthermore, they had both described tones as
being more or less dense at one time or another. Ne and Od had never heard of
tonal density and had, therefore, to be trained in its recognition. The training
was accomplished by presenting them with a high tone followed by a low tone and
asking them to notice the difference in the density of the two. They immediately
reported that the higher one was more dense. They were then presented with a
loud tone followed by a weak tone. In this case they both described the loud
tone as being more dense than the weak tone. Their judgments thus fell into line
with the reports of V and N.
The experimental procedure was to present alternately two tones of different
pitch and to require the O to equate them in density by changing the intensity
of one of the tones. This result was achieved by the use of an oscillator
(General Radio, type 508-A) in a circuit so designed that by means of a
switching device [5] two tones of different pitch could be presented alternately
at the rate of about 40 per min. One of the tones was of fixed intensity,
whereas the intensity of the other could be changed by a small variable
resistance held in the hands of the O. The O adjusted the intensity, taking as
much time as he desired, until the two tones seemed equal in density, and the
voltage was read directly from a voltmeter connected across the output of the
oscillator. Two Jensen "Concert Junior" dynamic speakers were used as the source
of sound. These speakers were mounted close to the head of the O, one over each
ear. The observing was done in a sound-room lined with a 2-in. blanket of rock
wool designed so as to minimize the reflection of the sound by the walls.
Each of six comparison tones was equated to the standard tone (500 cycles at
60 db above threshold) in both density and intensity. Equations were made in
respect of both aspects during each of five observational periods by each O. The
difference between the value at which a given tone was judged equal to the
standard in density and the value at which it was judged equal in intensity was
taken as a measure of the amount by which the two tones differed in density for
the particular O.
The results are shown in Table I. Values are given in both volts and db. The
values in db were computed from the liminal value which was empirically
determined as .001 volts. It will be noted that the magnitude of the difference
between the value at which a given tone was judged equal to the standard in
density and the value at which it was judged equal in intensity is approximately
the same for each O. One can thus average these differences for the purpose of
plotting a contour representing equal density.
TABLE I.
The results of matching 6 tones to the standard frequency 500 cycles at the
intensity level of 1.0 volt, or 60dB above the threshold value of .001 volt.
Each entry is the average of 10 observations.
| Frequency |
V |
N |
Ne |
Od |
| Density: |
Volts |
dB |
Volts |
dB |
Volts |
dB |
Volts |
dB |
| 400 |
2.04 |
66.18 |
1.34 |
62.54 |
2.35 |
67.42 |
1.51 |
63.58 |
| 450 |
1.63 |
64.24 |
1.16 |
61.28 |
1.92 |
65.51 |
1.35 |
62.60 |
| 475 |
1.22 |
61.72 |
1.10 |
60.82 |
1.72 |
64.71 |
1.19 |
65.51 |
| 525 |
.82 |
58.38 |
.94 |
59.46 |
.99 |
59.99 |
.90 |
59.08 |
| 550 |
.69 |
56.78 |
1.05 |
60.08 |
.85 |
58.59 |
.85 |
58.59 |
| 600 |
.44 |
52.86 |
.99 |
59.99 |
.77 |
57.73 |
.75 |
57.50 |
| Intensity: |
| 400 |
1.35 |
62.60 |
.94 |
59.46 |
1.53 |
63.69 |
1.12 |
60.98 |
| 450 |
1.18 |
61.42 |
.98 |
59.82 |
1.38 |
62.80 |
1.13 |
6.06 |
| 475 |
1.05 |
60.42 |
.98 |
59.82 |
1.34 |
62.54 |
1.07 |
60.58 |
| 525 |
.98 |
59.82 |
1.04 |
60.34 |
1.26 |
62.00 |
1.05 |
60.42 |
| 550 |
1.01 |
60.08 |
1.29 |
62.22 |
1.23 |
65.80 |
1.05 |
60.42 |
| 600 |
.87 |
58.79 |
1.38 |
63.80 |
1.25 |
61.94 |
1.05 |
60.42 |
| Difference between Density and Intensity
in dB |
| 400 |
|
3.58 |
|
3.08 |
|
3.73 |
|
2.60 |
| 450 |
|
2.82 |
|
5.46 |
|
2.75 |
|
5.54 |
| 475 |
|
1.40 |
|
5.00 |
|
2.17 |
|
.93 |
| 525 |
|
-1.44 |
|
-0.88 |
|
-2.01 |
|
-1.34 |
| 550 |
|
-3.30 |
|
-2.14 |
|
-3.21 |
|
-5.83 |
| 600 |
|
-5.93 |
|
-3.85 |
|
-4.21 |
|
-2.92 |
Table II shows the coefficients of variation (100 A.D./Mean) for the data of
Table I. The average coefficient of variation of the judgments in terms of
density is larger in the case of every O than the average coefficient of the
intensitive judgments. This difference may be interpreted as meaning that the
differential limen for density is larger than the differential limen for
intensity. A similar relationship has been found to obtain for volume. A
comparison of the coefficients of variation for the volumic judgments obtained
in the author's experiment on tonal volume with the present coefficients for
density reveals the fact that the coefficients are of comparable magnitude, an
equivalence which suggests that Halverson's [6] technique of the determination
of differential limens is not adequate as a means of showing the univocal status
of volume as an attribute. Had Halverson's Os been judging density instead of
volume, the magnitudes of the resultant limens would not necessarily have
revealed the fact.
TABLE II.
Coefficients of variation of the results obtained from 4 Os
Each coefficient is based upon 10 observations.
| Frequency |
V |
N |
Ne |
Od |
| Density: |
|
|
|
|
| 400 |
15.25 |
8.06 |
7.53 |
8.01 |
| 450 |
13.87 |
6.90 |
9.01 |
8.74 |
| 475 |
12.13 |
4.27 |
10.52 |
7.48 |
| 525 |
9.39 |
6.8 |
10.51 |
5.56 |
| 550 |
14.64 |
8.22 |
12.24 |
5.53 |
| 600 |
8.41 |
10.20 |
7.79 |
12.80 |
| Average |
12.28 |
7.41 |
9.60 |
6.02 |
| Intensity |
|
|
|
|
| 400 |
11.40 |
9.04 |
6.99 |
6.61 |
| 450 |
9.49 |
6.84 |
4.49 |
5.31 |
| 475 |
7.24 |
5.61 |
6.42 |
4.58 |
| 525 |
5.82 |
5.38 |
7.62 |
4.95 |
| 550 |
8.51 |
5.43 |
8.94 |
5.90 |
| 600 |
7.14 |
8.18 |
7.44 |
7.43 |
| Average |
8.27 |
6.75 |
6.98 |
5.80 |
Average of the average coefficients for density: 8.83
Average of the average coefficients for intensity: 6.95
Density is established as a discriminable aspect of tones distinct from
loudness and volume by the nature of the contour shown in Fig. 1. There,
the curve is plotted from the differences between the values at which two tones
are matched in density and the values at which they are matched in loudness, so
that the Os can not have confused density with loudness. The fact that they have
not confused density and volume is apparent from the fact that this contour has
a negative slope, whereas contour for equal volume, plotted in the same
coordinates, has a positive slope. The function means that in order that two
tones may be equal in volume, the higher 'tone must be made louder than the
lower tone. To make them equal in density, however, the lower tone must be made
louder than the higher.
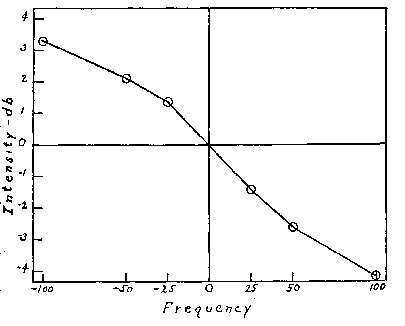
Figure 1. Contour representing equal density of 6 tones equated to a standard
tone (500 cycles, 60 db above the threshold), as plotted in positive and
negative deviations of frequency and intensity from the standard, which is
represented as the point 0,0 in the graph. Each point is the average of the data
from 4.0s.
The introspections of the Os show general agreement as to the phenomenal
basis of their judgments. V and Od, however, stated that density was not "penetratingness"
or "piercingness." They thought it might be possible to match two tones for "piercingness,"
but were uncertain as to whether the matches would be different from the
equations they made for density. V also had some difficulty at first in getting
the higher tones to lose their density when the loudness was decreased, a
difficulty which tended, however, to disappear with practice. Towards the end of
his series V said: "Low tones intrinsically lack density, but to make a high
tone lose its density it must be made quite faint. Then it becomes much like a
faint cloud. It loses its hard center, or rather, the hard center spreads out."
N stated: "The density of tones is not very hard to judge. It is one of the
most direct judgments I have made. Density is very much the same as the
penetrating quality of the tone. The thing I am judging as density is right in
the middle of the tone; it is the core of the tone, whereas what I was judging
as volume was the limits of the tone-- the outer edge. Sometimes I get visual
imagery. Then the low tones of poor density seem like attenuated smoke and the
dense tones appear as solid, heavy smoke."
The report of Ne was: "Some tones are thick-- others are thin or diffuse. The
high tones are packed solidly. They are solid all the way through. If one of
these tones is weakened in intensity, it becomes more scattered. Then it is
thinner and less dense."
Od was confused at first by the difference in pitch between the two tones,
but quickly overcame this difficulty. He reported: "Density seems to be somewhat
analogous to saturation; that is, it is the ratio of the amount of tone to the
amount of silence it is diluted in. It is the concentration of the tone-- the
amount per unit something or other. It is difficult to express."
The physiological basis of density is not obvious. One would like to think of
it as dependent upon the density of the nervous impulses reaching the cortex via
the auditory nerve. Volume, then, might depend upon the spread of these
impulses, as Boring [7] suggested, and intensity might depend upon the total
number arriving per unit time. Such a situation is conceivable in terms of a
resonance theory, but, in view of the present state of our knowledge, it is
perhaps wiser to limit ourselves to some such statement as the following. The
interaction of a sound wave with the auditory mechanism of a subject who has
been instructed to observe tonal density sets up a dynamic pattern of
neural excitation which is differentiated so as to issue in a specific
discriminatory response. Since the response when the instruction is to judge
density is different from the response which results when the subject is set to
observe volume or intensity, it must follow that the total neural pattern is
differentiated differently in each case, but the precise nature of the crucial
neural pattern and the manner of its arousal by the cochlear mechanism remains
obscure.
Another notion suggested by the outcome of this experiment is that the
existence of density as a phenomenal dimension may account for the fact that
weak tones are commonly .referred to as soft. In the usual description given of
a tone of slight density one finds such adjectives as "soft," "penetrable,"
loose," diffuse;" whereas dense tones are called "hard," "solid,"
"impenetrable." For a given pitch, the dense tones are the loud tones;
the tones which lack density are the weak tones. Hence, it may be that,
in the absence of a convenient antonym for loud, the word soft came to be used,
because it expresses one of the phenomenal characteristics of weak tones.
Summary.
1. In several previous experiments density has been reported as one of the
phenomenal aspects of tones.
2. The ease with which Os are able to equate in density two tones which
differ in pitch by changing the intensity of one of the tones indicates that
density is a discriminable aspect of tonal stimuli.
3. The average coefficients of variation of the equation of two tones for
density are larger than the coefficients of the equation of two tones for
intensity, and the coefficients for density are approximately equal to the
corresponding coefficients for volume.
4. The form of the contour for equal density, as plotted against frequency
and intensity (Fig. 1), shows that the Os did not confuse density either with
loudness or with volume.
5. The physiological basis of the experience of tonal density is at present
obscure.
(Manuscript received June 14, 1933)
Footnotes
1. G. J. Rich, A preliminary study of tonal volume, J. EXPER. PSYCHOL., 1916,
1,19.
2. R. Gundlach and M. Bentley, The dependence of tonal attributes upon phase,
Amer. J. Psychol., 1930, 42, 538.
3. Emeline R. Moul, An experimental study of visual and auditory `thickness,'
Amer. J. Psychol., r93o, 42, 551 f.
4. S. S. Stevens, The volume and intensity of tones, to be published in Amer.
J. Psychol. The apparatus used in the present experiment is described in this
paper.
5. S. S. Stevens, A switch for the presentation of
electrically generated tonal stimuli, to be published in Amer. J. Psychol.
6. H. M. Halverson, Tonal volume as a function of
intensity, Omer. J. Psychol., 1924, 35, 360-367.
7. E. G. Boring, Auditory theory with special reference to
intensity, volume and localization, Amer. J. Psychol., 1926, 37, 167 f. The idea
is more specifically stated by the same author in Physical Dimensions of
Consciousness, 1933, 85.
